Selection Sunday is one of the most eagerly anticipated sports days of the year, when 68 deserving teams of various levels are given the opportunity to begin their quest for college basketball’s most prestigious team honor, an NCAA tournament championship. Despite annual overtures to increase that number, we are thankfully still at 68 for the 2026 bracket. For many teams, it is an honor enough to see their name called when the brackets are revealed, and winning a game or two would only be icing on the cake. For others, the goal is a national title, or at least a Final Four berth, and nothing shy of that will do. As always, there are a bunch of teams somewhere in between.
As we all start to consider our potential wagers, or the filling out of our brackets, it definitely pays to know what separates these teams into the different tiers. Which of this year’s teams is best positioned to make a title run, or alternatively, most vulnerable to getting eliminated early?
Every year at this time, I do this much-touted piece that I call the “Shared Traits of NCAA Tournament Teams”, in which I look at the statistical and strength rating characteristics of Upset Victims, Cinderellas, Final Four, and Champion teams over the last 10 tournament seasons. I then compare the resumes of those teams to the 68 teams in the current year’s bracket. It gives readers a good sense of the prognosis for each team.
When I say “characteristics,” I have picked out 12 key statistical categories and four of my personal Strength Indicators, plus a Combined Average Ranking, and charted the recent qualifying teams by their performance in these categories. Here they are:
- Steve Makinen’s Power Rating
- Opponent Power Rating (Schedule Strength)
- Offensive Points per Game
- Defensive Points per Game
- Steve Makinen’s Effective Strength Indicator
- Steve Makinen’s Bettors’ Rating
- Steve Makinen’s Momentum Ratings
- Effective Offensive Points per Possession
- Effective Defensive Points per Possession
- Offensive Field Goal %
- Offensive 3PT Field Goal %
- Rebounding Percentage
- Assist to Turnover Ratio
- Offensive Turnovers per Possession
- Defensive Turnovers per Possession
- Defensive Field Goal %
- Combined Average Ranking
After determining the national season rankings for all Division 1 teams, I pulled all Upset Victims, Cinderellas, Final Four teams, and Champion teams from the last 10 tournaments for special analysis. For each stat category, I look for the minimum performance, the typical national ranking, and the percentage of teams that qualify within certain ranges. As a final exclamation point on the analysis, I take a Combined National Ranking of the 15 sortable categories to separate the more complete teams from the rest.
To summarize the findings, the relationship in my Effective Strength Indicator was the most significant among all the categories analyzed. The average of the last 40 Final Four teams ranked 13.55 in the country in that rating. Among the hard-core statistical categories, Effective Offensive Points per Possession has now become the most important, with an average Final 4 team ranking of 17.25 over the last 10 tournaments, 3.8 spots higher than the same rating for defense. Interestingly, the least important factor was Defensive Turnovers per Possession, or the ability to force turnovers on defense.
First, a quick reminder of what happened last season in terms of my analysis using the combined rankings. It was a rather dull tournament if you were looking for Cinderellas, as the only lower seed to reach the Sweet 16 was #10 Arkansas, who would be eliminated at that point. It was the second straight year that only one “Cinderella team” made it to the second weekend, a result of two “chalky” tournaments in a row. In addition, only three top-6-seeded teams were upset in the first round, a very low number. Clemson & Memphis were among the early outs, and those two teams were among the five most likely upset victims on the chart. Of course, the highlight of this piece last year was of course Florida, who topped both the potential Champions and potential Final Four team charts with perfect scores. Duke also had a perfect Final Four qualification score and eventually reached that point before losing to Houston. The Gators were a popular title wager for a lot of VSiN bettors, particularly after seeing this analysis.
In summary, it was another very successful tournament for my Shared Traits article, and hopefully, you were among the many who reaped the benefits. Of course, for me, these charts are now fixed in my own must-do list before completing any brackets or placing any wagers.
Let’s look more closely at each of the qualifying charts I just described, and how the teams stack up for 2026.
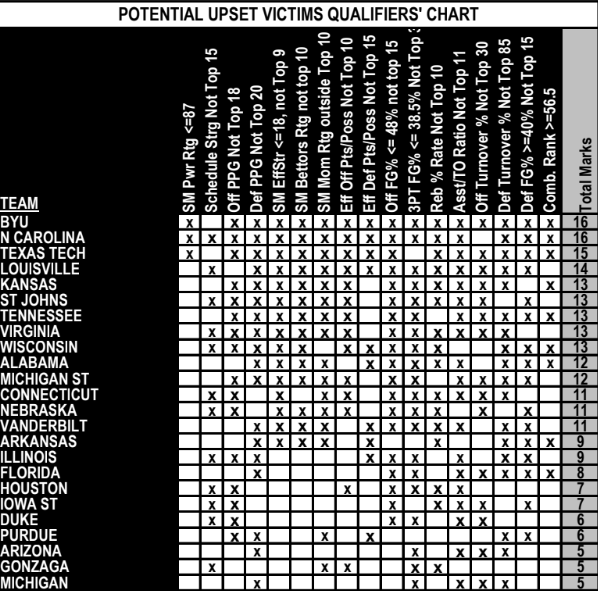
Shared Traits of Upset Victim Teams
Embed from Getty ImagesThe following is a list of the traits shared by teams that would be considered ‘Upset Victims,” or those that were seeded #6 or better and lost their first round game. In general, I use an 80th-percentile cutoff to eliminate some of the more fluky teams from recent years. These stats include only those obtained as of Selection Sunday and contain no games beyond that point, so they should be accurately reflective of those you’ll be using when picking this year’s brackets. These were the Upset Victims considered:
2015
#3’s: IOWA STATE, BAYLOR
#6’s: SMU, PROVIDENCE
2016
#2’s: MICHIGAN STATE
#3’s: WEST VIRGINIA
#4’s: CALIFORNIA
#5’s: BAYLOR, PURDUE
#6’s: SETON HALL, ARIZONA, TEXAS
2017
#5’s: MINNESOTA
#6’s: MARYLAND, SMU, CREIGHTON
2018
#1’s: VIRGINIA
#4’s: WICHITA STATE
#5’s: ARIZONA
#6’s: MIAMI (FL), TCU
2019
#4’s: KANSAS STATE
#5’s: MARQUETTE, MISSISSIPPI STATE, WISCONSIN
#6’s: IOWA STATE
2021
#2’s: OHIO STATE
#3’s: TEXAS
#4’s: PURDUE, VIRGINIA
#5’s: TENNESSEE
#6’s: BYU, SAN DIEGO STATE
2022
#2’s: KENTUCKY
#5’s: IOWA, CONNECTICUT
#6’s: ALABAMA, LSU, COLORADO STATE
2023
#1: PURDUE
#2: ARIZONA
#4: VIRGINIA
#6: IOWA STATE
2024
#3: KENTUCKY
#4’s: AUBURN
#5’s: ST MARY’S (CA), WISCONSIN
#6’s: BYU, TEXAS TECH, SOUTH CAROLINA, FLORIDA
2025
#5’s: CLEMSON, MEMPHIS
#6: MISSOURI
Of these last 55 Upset Victims seeded #6 or better, approximately 80% of them:
- Went into the tournament with a Steve Makinen Power Rating of 87 or lower.
- Finished the regular season with a Schedule Strength ranked outside the top 15 nationally.
- Ranked outside the Top 18 in Offensive Points per Game.
- Ranked outside the Top 20 in Defensive Points per Game.
- Had a Steve Makinen Effective Strength Indicator Rating of +18 or less and/or ranked outside the Top 9 nationally.
- Had a Steve Makinen Bettors Rating of at most -16 and/or ranked outside the Top 10 nationally.
- Had a Steve Makinen Momentum Rating outside the Top 10 nationally.
- Scored less than 1.235 Effective Points per Possession on offense and/or ranked outside the Top 10 nationally.
- Allowed more than 0.94 Effective Points per Possession on defense and/or ranked outside the Top 15 nationally.
- Shot less than 48% from the field on the season, ranking outside the Top 15 nationally in FG%.
- Made less than 38.5% of their 3PT attempts on the season, placing them outside the Top 30 of all teams.
- Had a Rebounding Percentage Rate of less than 55.4% and ranked outside the Top 10 of the country.
- Had an Assist to Turnover Ratio of less than 1.57, ranking outside the Top 11 nationally.
- Ranked outside the country’s 30 top teams in terms of Offensive Turnovers per Possession (approx. 15%).
- Ranked outside the country’s 85 top teams in terms of Defensive Turnovers per Possession (approx. 19%)
- Allowed opponents 40% or higher on field goal attempts, a mark typically not good enough for the Top 15 in the country.
- Had a Combined Average Ranking of 56.5 or worse in all of the analyzed stats.
Using the logic of qualifying all of this year’s 24 teams seeded #6 or better under our criteria above, here is a chart showing the number of times each team qualified for the 17 categories. Based on our belief that the Upset Victims share characteristics, the teams at the top of the list are at the greatest risk of getting upset in their first-round games.
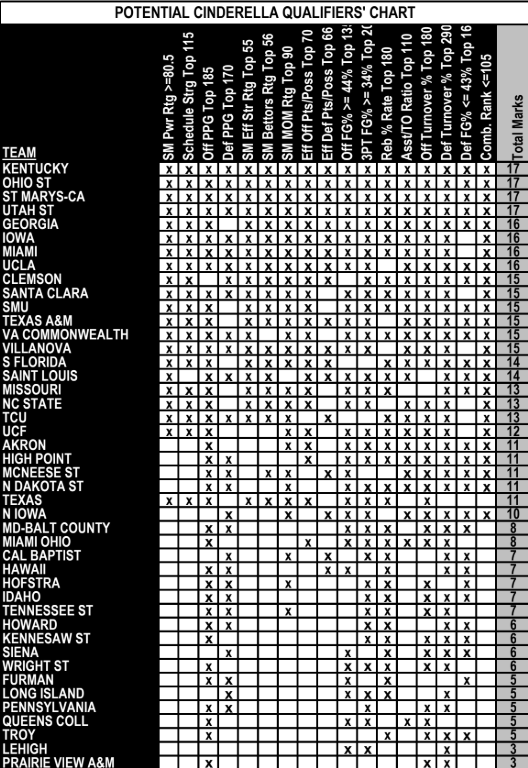
Shared Traits of Cinderella Teams
The following is a list of the traits shared by teams that could be considered ‘Cinderella Teams,’ or those that were seeded #7 or less and won at least two games to reach the Sweet 16. In general, I again use an 80th percentile cutoff to eliminate some of the more fluky teams from recent years. These stats include only those obtained as of Selection Sunday and contain no games beyond that point, so they should be accurately reflective of those you’ll be using when picking this year’s brackets. Note that ARKANSAS was at the top of the potential Cinderella chart last year and was the only lower-seeded team to reach the Sweet 16. These were the Cinderella Teams considered:
2015 MICHIGAN STATE (#7)
2015 WICHITA STATE (#7)
2015 NC STATE (#8)
2015 UCLA (#11)
2016 GONZAGA (#11)
2016 SYRACUSE (#10)
2017 SOUTH CAROLINA (#7)
2017 MICHIGAN (#7)
2017 WISCONSIN (#8)
2017 XAVIER (#11)
2018 FLORIDA STATE (#9)
2018 KANSAS STATE (#9)
2018 LOYOLA (IL) (#11)
2018 NEVADA (#7)
2018 SYRACUSE (#11)
2018 TEXAS A&M (#7)
2019 OREGON (#12)
2021 OREGON (#7)
2021 LOYOLA (IL) (#8)
2021 UCLA (#11)
2021 SYRACUSE (#11)
2021 OREGON STATE (#12)
2021 ORAL ROBERTS (#15)
2022 NORTH CAROLINA (#8)
2022 MIAMI (FL) (#10)
2022 IOWA STATE (#11)
2022 MICHIGAN (#11)
2022 ST PETER’S (#15)
2023 MICHIGAN STATE (#7)
2023 ARKANSAS (#8)
2023 FLORIDA ATLANTIC (#9)
2023 PRINCETON (#15)
2024 NC STATE (#11)
2025 ARKANSAS (#10)
Of the last 34 Cinderella teams seeded #7 or worse, approximately 80% of them:
- Went into the tournament with a Steve Makinen Power Rating of 80.5 or better.
- Finished the regular season with a Schedule Strength ranked in the top 115 nationally.
- Ranked in the Top 185 in Offensive Points per Game, scoring around 70+ PPG.
- Ranked in the Top 170 in Defensive Points per Game, allowing approximately less than 70 PPG.
- Had a Steve Makinen Effective Strength Indicator Rating of at least +10.0 and/or ranked in the Top 55 nationally.
- Had a Steve Makinen Bettors Rating of at least -9.0 and/or ranked in the Top 56 nationally.
- Had a Steve Makinen Momentum Rating in the Top 90 nationally
- Scored at least 1.125 Effective Points per Possession on offense and ranked in the Top 70 nationally.
- Allowed better than 1.01 Effective Points per Possession on defense and ranked in the Top 66 nationally.
- Shot at least 44% from the field on the season, ranking in the Top 135 nationally in FG%.
- Made about 34% of its 3PT attempts on the season, placing them in the Top 200 of all teams.
- Had a Rebounding Percentage Rate of at least 50% and ranked in the Top 180 of the country.
- Had an Assist to Turnover Ratio of at least 1.13, ranking in the Top 110 nationally.
- Ranked in the country’s 180 top teams in terms of Offensive Turnovers per Possession (approx. 18%).
- Ranked in the country’s 290 top teams in terms of Defensive Turnovers per Possession (approx. 16.5%).
- Allowed opponents worse than 43% on field goal attempts, a mark typically good enough for the Top 160 in the country.
- Had a Combined Average Ranking of 105.0 or better in all of our analyzed stats.
Using the logic of qualifying all of this year’s 44 teams seeded #7 or worse under our criteria above, here is a chart showing the number of times each team qualified for the 17 categories. Based on our belief that Cinderella teams share quality characteristics, the teams at the top of the list are best prepared to make an exciting tournament run.
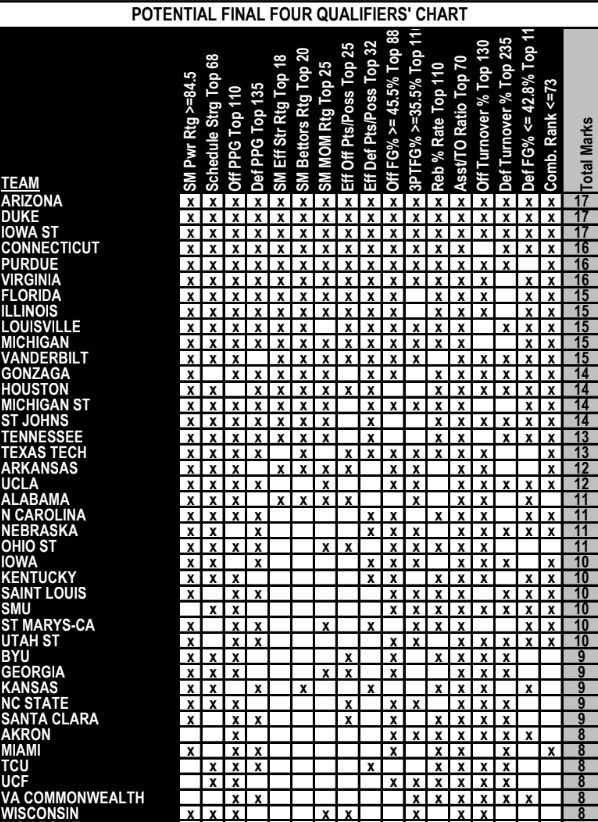
Shared Traits of Final Four Teams
The following is a list of the traits shared by teams that eventually reached the Final Four. Again, considering an 80th percentile cutoff to eliminate unusual teams from recent years. These were the last 40 Final Four teams:
2015 KENTUCKY (#1)
2015 DUKE (#1)
2015 WISCONSIN (#1)
2015 MICHIGAN STATE (#7)
2016 OKLAHOMA (#2)
2016 NORTH CAROLINA (#1)
2016 VILLANOVA (#2)
2016 SYRACUSE (#10)
2017 NORTH CAROLINA (#1)
2017 GONZAGA (#1)
2017 OREGON (#3)
2017 SOUTH CAROLINA (#7)
2018 LOYOLA (IL) (#11)
2018 KANSAS (#1)
2018 MICHIGAN (#3)
2018 VILLANOVA (#1)
2019 VIRGINIA (#1)
2019 MICHIGAN STATE (#2)
2019 TEXAS TECH (#3)
2019 AUBURN (#5)
2021 GONZAGA (#1)
2021 BAYLOR (#1)
2021 HOUSTON (#2)
2021 UCLA (#11)
2022 KANSAS (#1)
2022 DUKE (#2)
2022 VILLANOVA (#2)
2022 NORTH CAROLINA (#8)
2023 CONNECTICUT (#4)
2023 MIAMI (FL) (#5)
2023 SAN DIEGO STATE (#5)
2023 FLORIDA ATLANTIC (#9)
2024 CONNECTICUT (#1)
2024 PURDUE (#1)
2024 ALABAMA (#4)
2024 NC STATE (#11)
2025 AUBURN (#1)
2025 DUKE (#1)
2025 FLORIDA (#1)
2025 HOUSTON (#1)
Of the last 40 Final Four teams, approximately 80% of them:
- Went into the tournament with a Steve Makinen Power Rating of 84.5 or higher.
- Finished the regular season with a Schedule Strength ranked in the top 68 nationally.
- Ranked in the Top 110 in Offensive Points Per Game, scoring about 72.8 PPG or more.
- Ranked in the Top 135 in Defensive Points Per Game, allowing about 70 PPG or less.
- Had a Steve Makinen Effective Strength Indicator Rating of at least +15.0 and ranked in the Top 18 nationally.
- Had a Steve Makinen Bettors Rating of at least -13.5 and ranked in the Top 20 nationally.
- Had a Steve Makinen Momentum Rating ranked in the Top 25 nationally.
- Scored at least 1.185 Effective Points per Possession on offense and ranked in the Top 25 nationally.
- Allowed better than 0.970 Effective Points per Possession on defense and ranked in the Top 32 nationally.
- Shot better than 45.5% from the field on the season, ranking in the Top 88 nationally in FG%.
- Made at least 35.5% of its 3PT attempts on the season, placing them in the Top 110 of all teams.
- Had a Rebounding Percentage Rate of at least 51.5% and ranked in the Top 110 of the country.
- Had an Assist to Turnover Ratio of at least 1.23, ranking in the Top 70 nationally.
- Ranked in the country’s 130 top teams in terms of Offensive Turnovers per Possession.
- Ranked in the country’s 235 top teams in terms of Defensive Turnovers per Possession.
- Allowed opponents about 42.8% or less on field goal attempts, a mark typically good enough for the Top 115 in the country.
- Had a Combined Average Ranking of 73.0 or better in all of our analyzed stats.
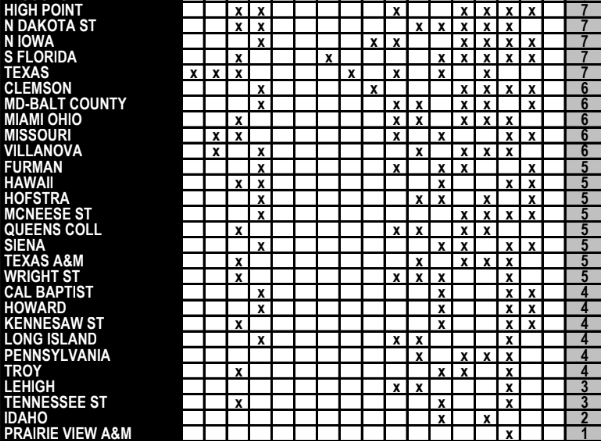
Using the logic of qualifying all of this year’s 68 teams under our criteria above, here is a chart showing the number of times each team qualified for the 17 categories. Based upon our belief that the Final Four teams share quality characteristics, the teams at the top of the list are most prepared to make a deep tournament run to Indianapolis.
Shared Traits of Tournament Champions
Recent years of tournament action have shown that there is a big difference in reaching the Final Four and winning the title. Typically, only the truly elite teams accomplish the latter. Last year, that point was again exacerbated, with Florida winning it all. Here’s a look at the minimum requirements for winning a tournament championship over the last decade-plus. Just to jog your memory, these are the 10 champions and their seed during that time span:
2015 DUKE (#1)
2016 VILLANOVA (#2)
2017 NORTH CAROLINA (#1)
2018 VILLANOVA (#1)
2019 VIRGINIA (#1)
2021 BAYLOR (#1)
2022 KANSAS (#1)
2023 CONNECTICUT (#4)
2024 CONNECTICUT (#1)
2025 FLORIDA (#1)
Looking for clear separations in the teams’ stats/ranks, of the last 10 NCAA Champions, I usually seek an 80th percentile or higher when separating the best from the rest:
- Nine of them went into the tournament with a Steve Makinen Power Rating of 89.5 or higher.
- Eight of them finished the regular season with a Schedule Strength ranked in the top 46 nationally.
- Nine of them ranked in the Top 55 in Offensive Points per Game and scored at least 76.5 PPG.
- Eight of them ranked in the Top 115 in Defensive Points per Game or allowed less than 70 PPG.
- Eight of them had a Steve Makinen Effective Strength Indicator Rating of at least +20 and ranked in the Top 5 nationally.
- Ten of them had a Steve Makinen Bettors Rating of at least -17.5 and ranked in the Top 5 nationally.
- Eight of them had a Steve Makinen Momentum Rating ranked in the Top 6 nationally
- Nine of them scored at least 1.245 Effective Points per Possession on offense and ranked in the Top 5 nationally.
- Eight of them allowed better than 0.965 Effective Points per Possession on defense, and seven of them ranked in the Top 15 nationally.
- Nine of them shot at least 46.5% from the field on the season, ranking in the Top 45 nationally in FG%.
- Nine of them made at least 35.5% of their 3PT attempts on the season, placing them in the Top 100 of all teams.
- Eight of them had a Rebounding Percentage Rate of at least 53% and ranked in the Top 40 of the country.
- Eight of them had an Assist-to-Turnover Ratio of at least 1.380, ranking in the Top 30 nationally.
- Eight of them ranked in the country’s 100 top teams in terms of Offensive Turnovers per Possession.
- Eight of them ranked in the country’s 190 top teams in terms of Defensive Turnovers per Possession.
- Nine of them allowed opponents 42.0% or less on field goal attempts, a mark typically good enough for the Top 75 in the country.
- Nine of them had a Combined Average Ranking of 50 or better in all of our analyzed stats.
Looking at each of these key categories and every team’s standing as of Sunday (3/15), here is a chart showing the teams most ready for a title run in 2026.
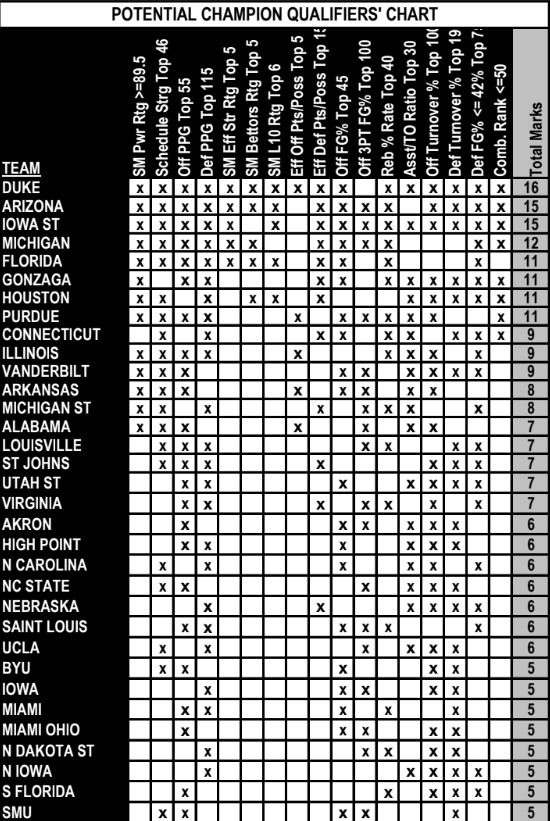
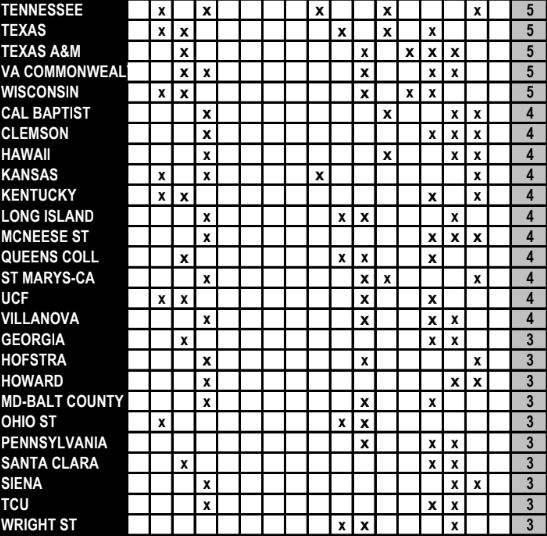
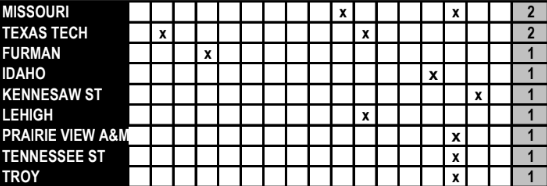
A reminder from recent years on the Potential Champions Chart: Virginia, the 2019 champion, and a popular pick of many experts, such as yours truly, ranked second of the 68 tournament teams with 15 qualifying marks on this chart. Baylor of 2021 ranked 3rd with 13 marks. Only Michigan and Gonzaga were better. In 2022, Kansas ranked behind six other teams in championship “worthiness” with 11 marks. No team above the Jayhawks reached the Final Four. And in each of UConn’s title years, it topped the chart, with 14 marks in 2023 and 15 in 2024. And finally, last year, Florida tied atop the chart with a perfect 17 marks! In other words, we are currently on a three-year winning streak with the eventual champion topping this analysis. In that sense alone, it commands respect.
Each year it seems to prove again and again that it’s a fairly safe bet to say that the eventual Upset Victims, Cinderellas, Final Four teams and Champion will be found amongst the top of these respective lists. I will be personally investing heavily in this resource again for 2026.
The post Shared Traits of March Madness Upset Victims, Cinderellas, Final Four, & Championship Teams appeared first on VSiN.


Leave A Comment